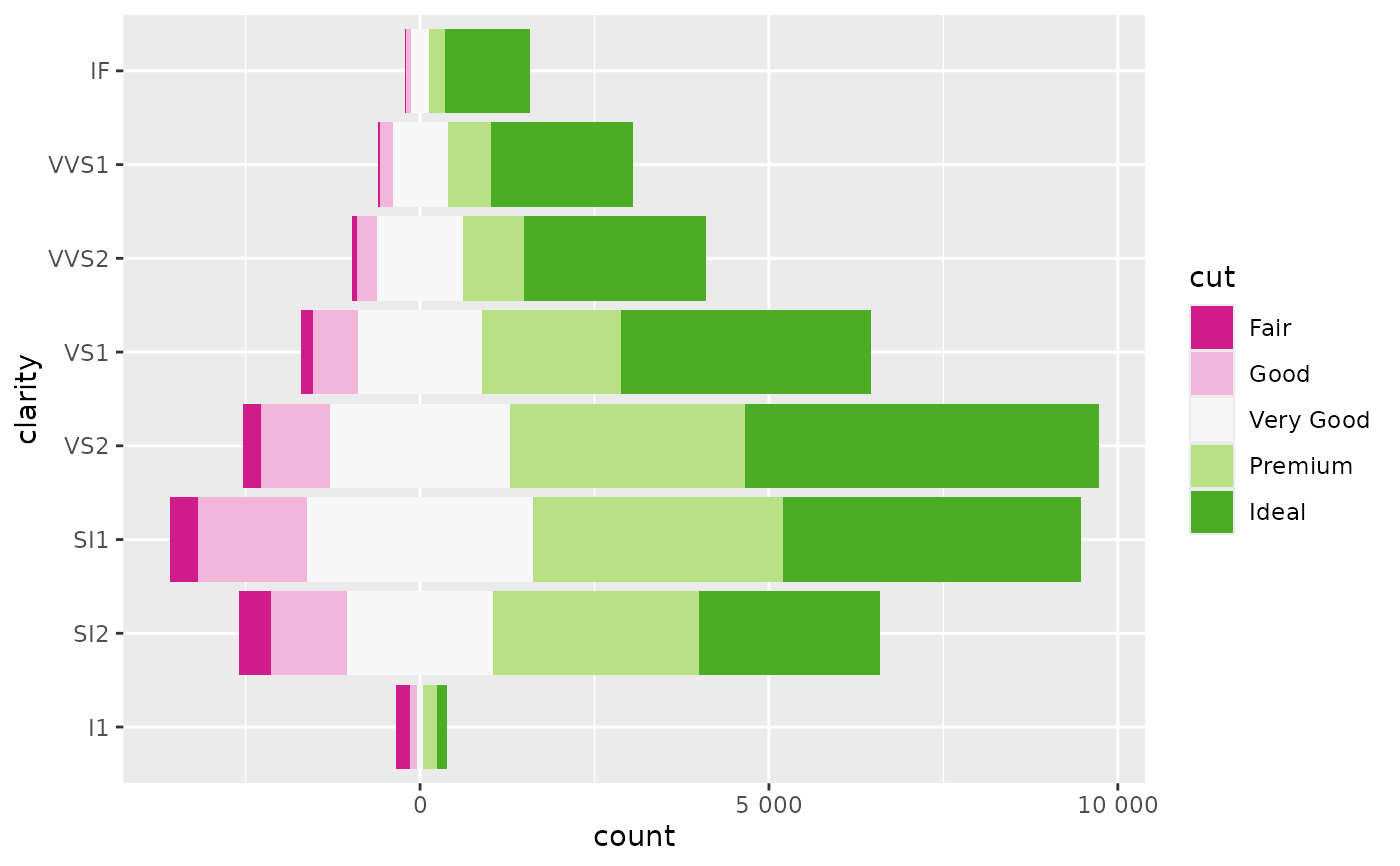
Stack objects on top of each another and center them around 0
Source:R/position_likert.R
position_likert.Rdposition_diverging() stacks bars on top of each other and
center them around zero (the same number of categories are displayed on
each side).
position_likert() uses proportions instead of counts. This type of
presentation is commonly used to display Likert-type scales.
Usage
position_likert(
  vjust = 1,
  reverse = FALSE,
  exclude_fill_values = NULL,
  cutoff = NULL
)

position_diverging(
  vjust = 1,
  reverse = FALSE,
  exclude_fill_values = NULL,
  cutoff = NULL
)
Arguments
- vjust
Vertical adjustment for geoms that have a position (like points or lines), not a dimension (like bars or areas). Set to
0to align with the bottom,0.5for the middle, and1(the default) for the top.- reverse
If
TRUE, will reverse the default stacking order. This is useful if you're rotating both the plot and legend.- exclude_fill_values
Vector of values from the variable associated with the
fillaesthetic that should not be displayed (but still taken into account for computing proportions)- cutoff
number of categories to be displayed negatively (i.e. on the left of the x axis or the bottom of the y axis), could be a decimal value:
2to display negatively the two first categories,2.5to display negatively the two first categories and half of the third,2.2to display negatively the two first categories and a fifth of the third (see examples). By default (NULL), it will be equal to the number of categories divided by 2, i.e. it will be centered.
Details
It is recommended to use position_likert() with stat_prop()
and its complete argument (see examples).
Examples
library(ggplot2)
ggplot(diamonds) +
aes(y = clarity, fill = cut) +
geom_bar(position = "fill") +
scale_x_continuous(label = scales::label_percent()) +
xlab("proportion")
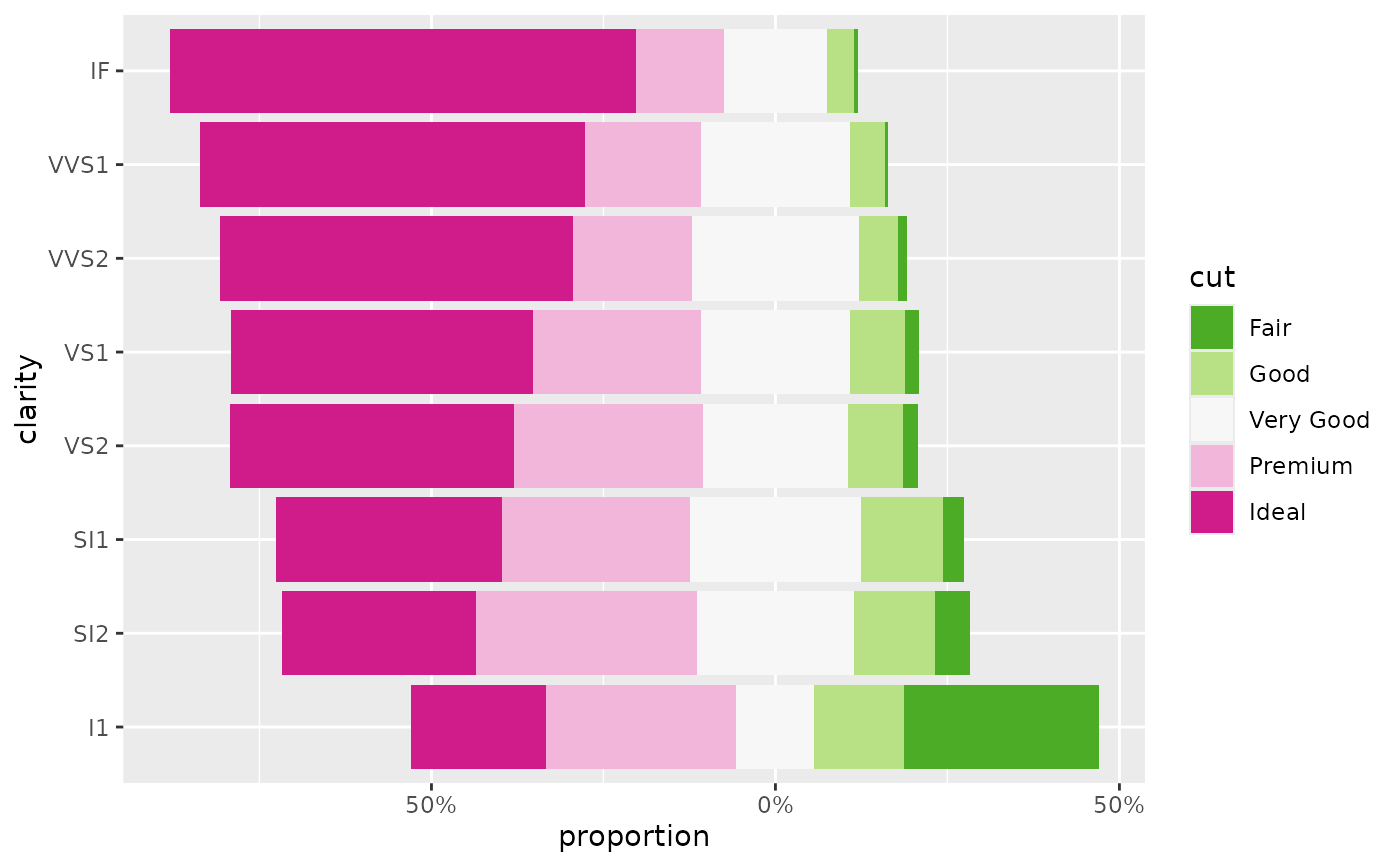
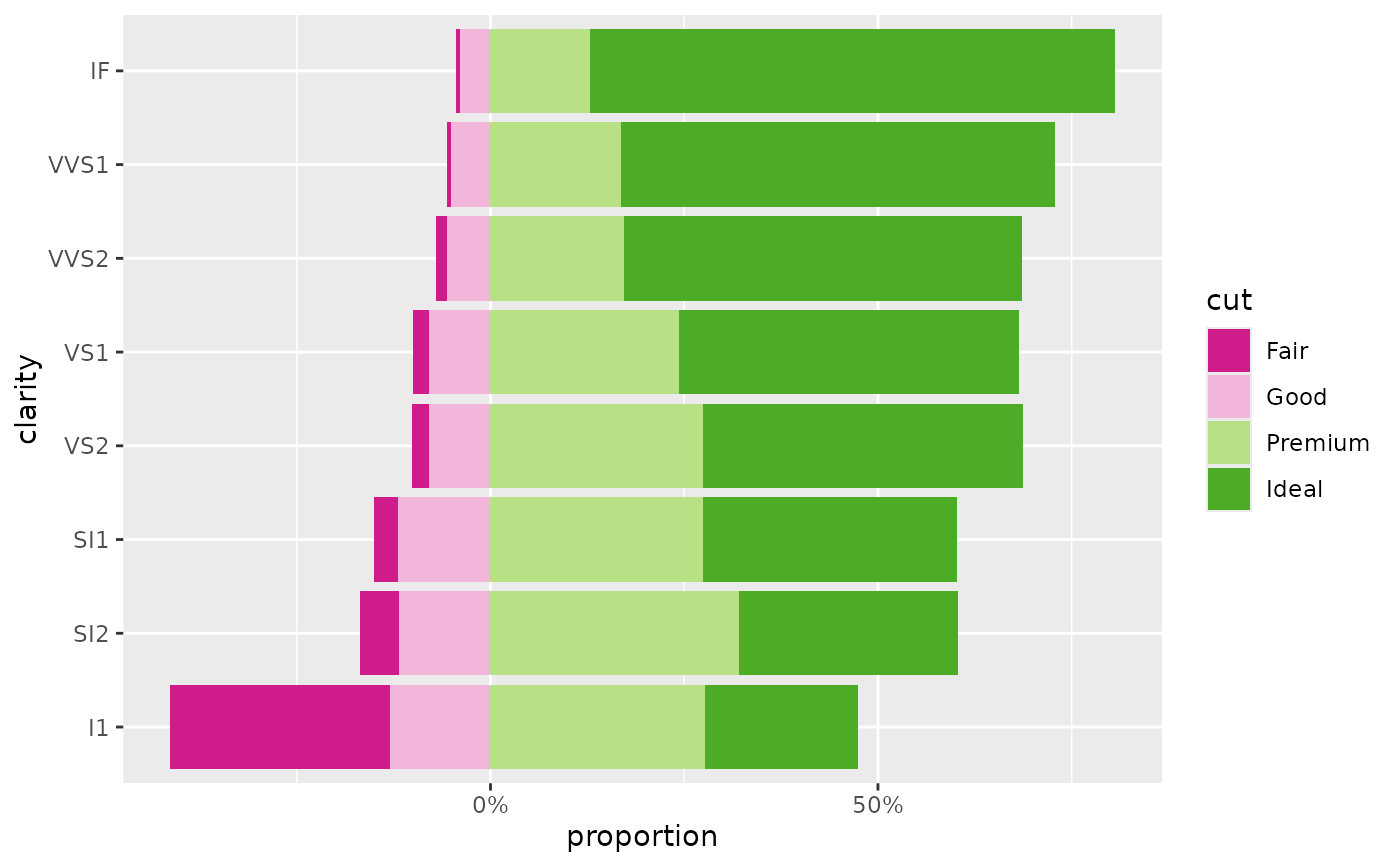
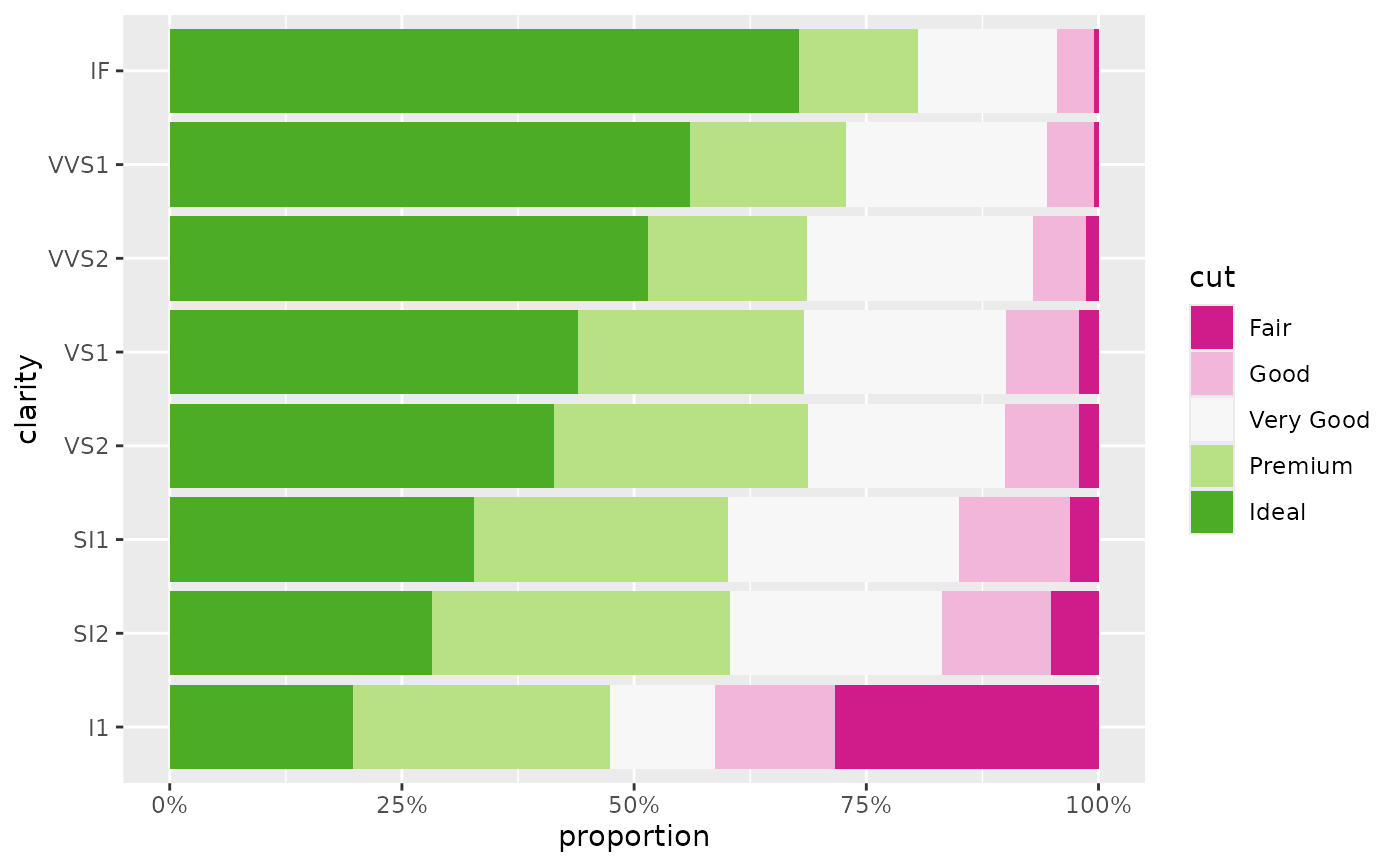 ggplot(diamonds) +
aes(y = clarity, fill = cut) +
geom_bar(position = "likert") +
scale_x_continuous(label = label_percent_abs()) +
scale_fill_likert() +
xlab("proportion")
ggplot(diamonds) +
aes(y = clarity, fill = cut) +
geom_bar(position = "likert") +
scale_x_continuous(label = label_percent_abs()) +
scale_fill_likert() +
xlab("proportion")
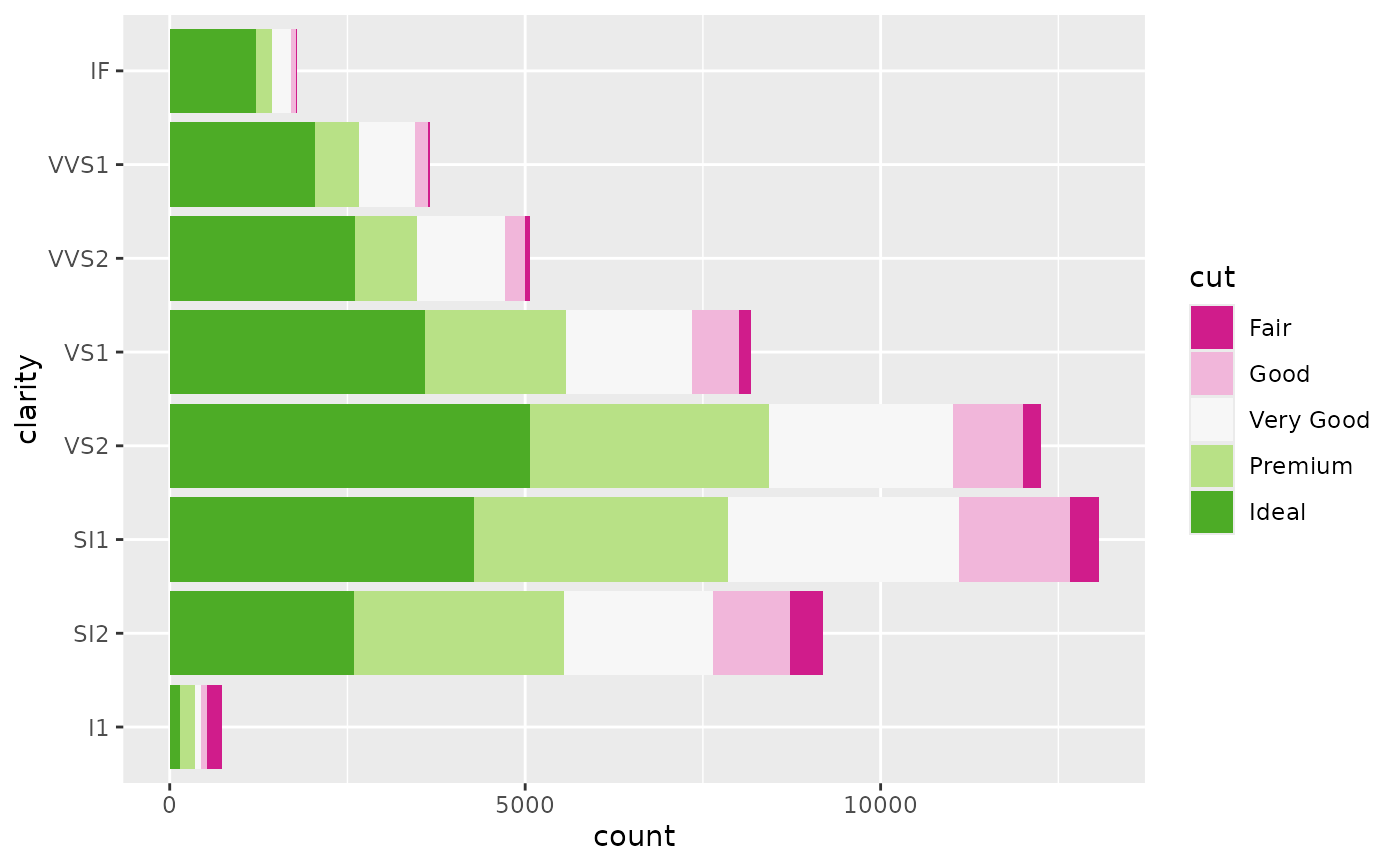
 ggplot(diamonds) +
aes(y = clarity, fill = cut) +
geom_bar(position = "stack") +
scale_fill_likert(pal = scales::brewer_pal(palette = "PiYG"))
ggplot(diamonds) +
aes(y = clarity, fill = cut) +
geom_bar(position = "stack") +
scale_fill_likert(pal = scales::brewer_pal(palette = "PiYG"))
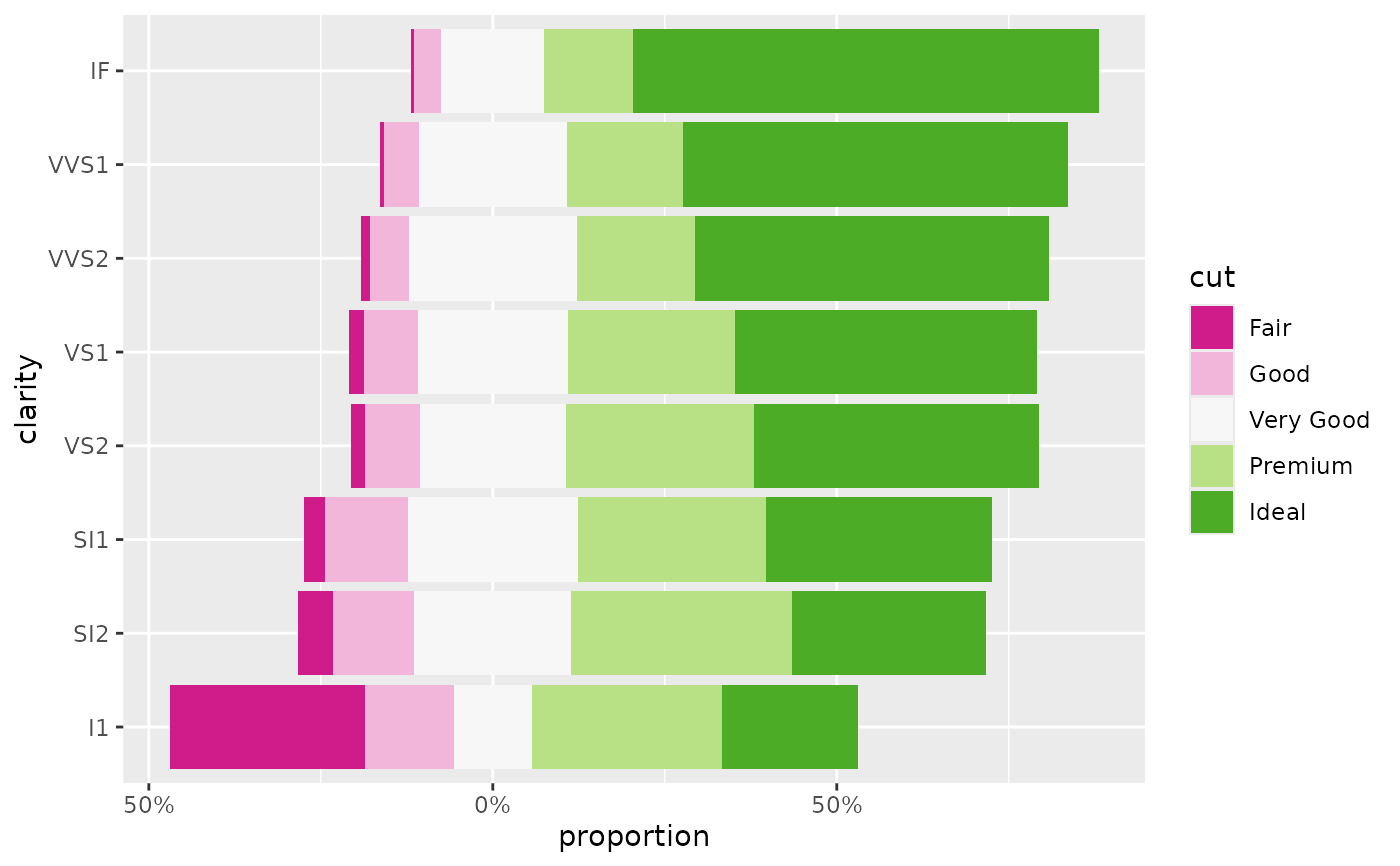
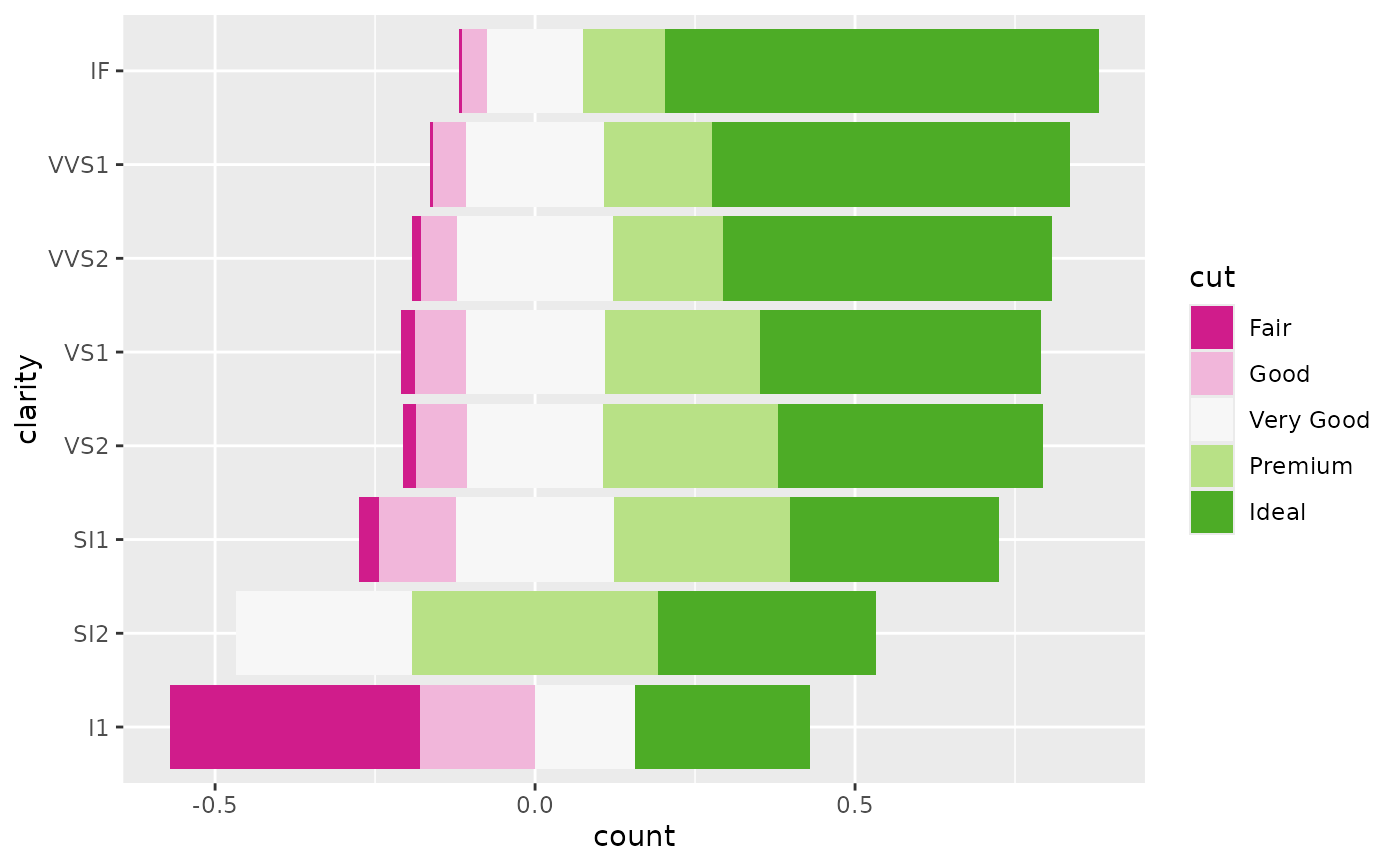
 ggplot(diamonds) +
aes(y = clarity, fill = cut) +
geom_bar(position = "diverging") +
scale_x_continuous(label = label_number_abs()) +
scale_fill_likert()
ggplot(diamonds) +
aes(y = clarity, fill = cut) +
geom_bar(position = "diverging") +
scale_x_continuous(label = label_number_abs()) +
scale_fill_likert()
 # \donttest{
# Reverse order -------------------------------------------------------------
ggplot(diamonds) +
aes(y = clarity, fill = cut) +
geom_bar(position = position_likert(reverse = TRUE)) +
scale_x_continuous(label = label_percent_abs()) +
scale_fill_likert() +
xlab("proportion")
# \donttest{
# Reverse order -------------------------------------------------------------
ggplot(diamonds) +
aes(y = clarity, fill = cut) +
geom_bar(position = position_likert(reverse = TRUE)) +
scale_x_continuous(label = label_percent_abs()) +
scale_fill_likert() +
xlab("proportion")
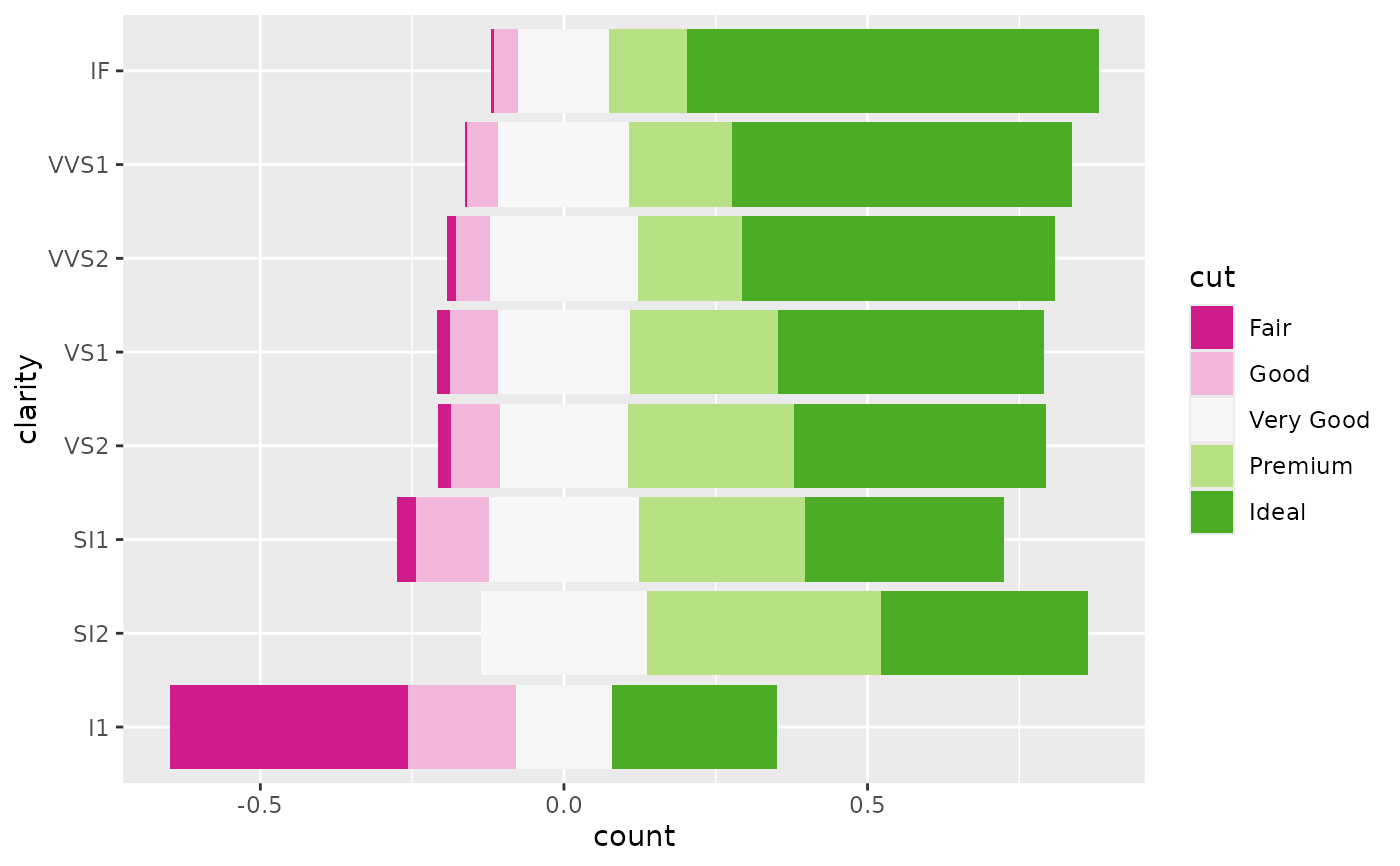
 # Custom center -------------------------------------------------------------
ggplot(diamonds) +
aes(y = clarity, fill = cut) +
geom_bar(position = position_likert(cutoff = 1)) +
scale_x_continuous(label = label_percent_abs()) +
scale_fill_likert(cutoff = 1) +
xlab("proportion")
# Custom center -------------------------------------------------------------
ggplot(diamonds) +
aes(y = clarity, fill = cut) +
geom_bar(position = position_likert(cutoff = 1)) +
scale_x_continuous(label = label_percent_abs()) +
scale_fill_likert(cutoff = 1) +
xlab("proportion")
 ggplot(diamonds) +
aes(y = clarity, fill = cut) +
geom_bar(position = position_likert(cutoff = 3.75)) +
scale_x_continuous(label = label_percent_abs()) +
scale_fill_likert(cutoff = 3.75) +
xlab("proportion")
ggplot(diamonds) +
aes(y = clarity, fill = cut) +
geom_bar(position = position_likert(cutoff = 3.75)) +
scale_x_continuous(label = label_percent_abs()) +
scale_fill_likert(cutoff = 3.75) +
xlab("proportion")
 # Missing items -------------------------------------------------------------
# example with a level not being observed for a specific value of y
d <- diamonds
d <- d[!(d$cut == "Premium" & d$clarity == "I1"), ]
d <- d[!(d$cut %in% c("Fair", "Good") & d$clarity == "SI2"), ]
# by default, the two lowest bar are not properly centered
ggplot(d) +
aes(y = clarity, fill = cut) +
geom_bar(position = "likert") +
scale_fill_likert()
# Missing items -------------------------------------------------------------
# example with a level not being observed for a specific value of y
d <- diamonds
d <- d[!(d$cut == "Premium" & d$clarity == "I1"), ]
d <- d[!(d$cut %in% c("Fair", "Good") & d$clarity == "SI2"), ]
# by default, the two lowest bar are not properly centered
ggplot(d) +
aes(y = clarity, fill = cut) +
geom_bar(position = "likert") +
scale_fill_likert()
 # use stat_prop() with `complete = "fill"` to fix it
ggplot(d) +
aes(y = clarity, fill = cut) +
geom_bar(position = "likert", stat = "prop", complete = "fill") +
scale_fill_likert()
# use stat_prop() with `complete = "fill"` to fix it
ggplot(d) +
aes(y = clarity, fill = cut) +
geom_bar(position = "likert", stat = "prop", complete = "fill") +
scale_fill_likert()
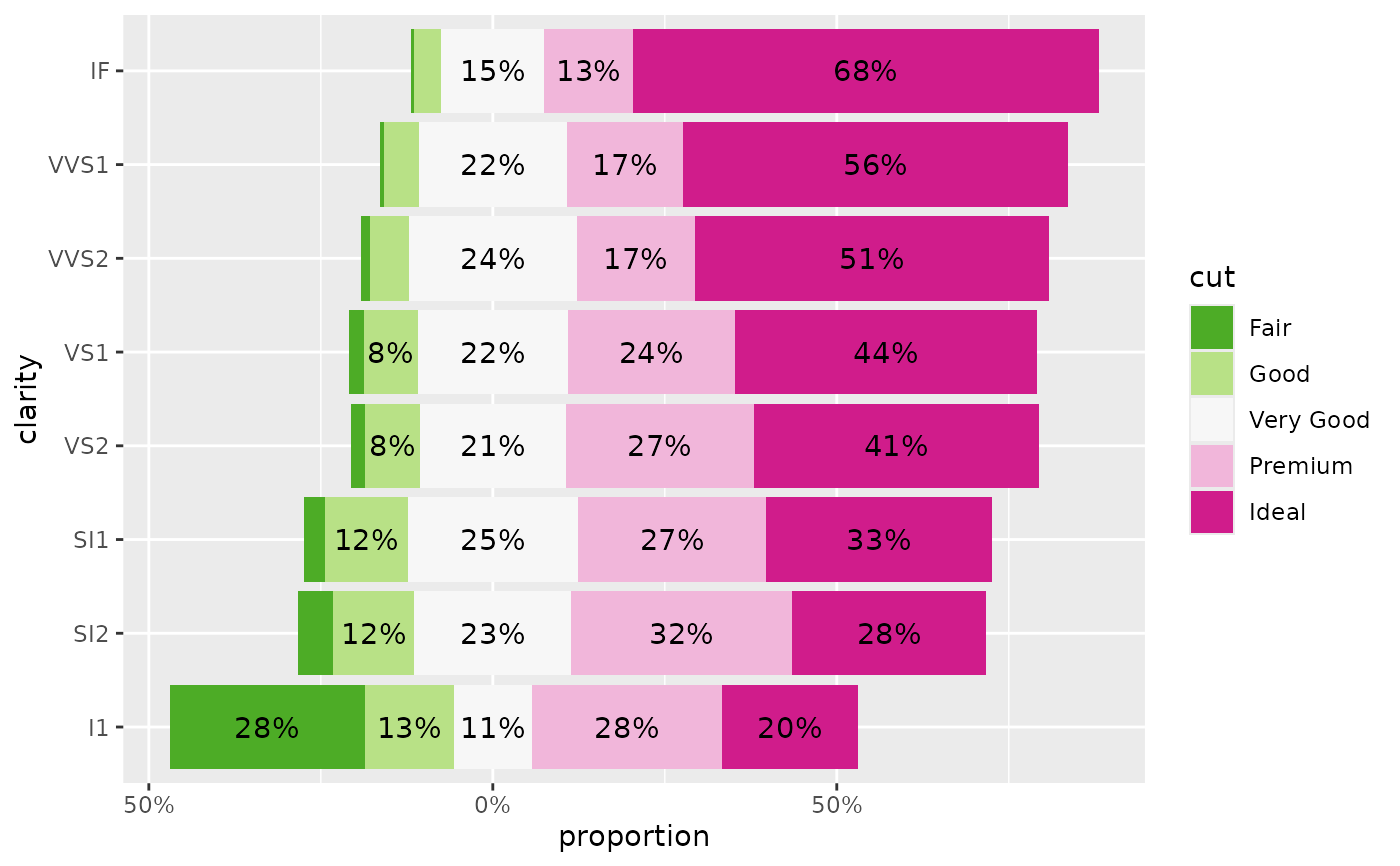
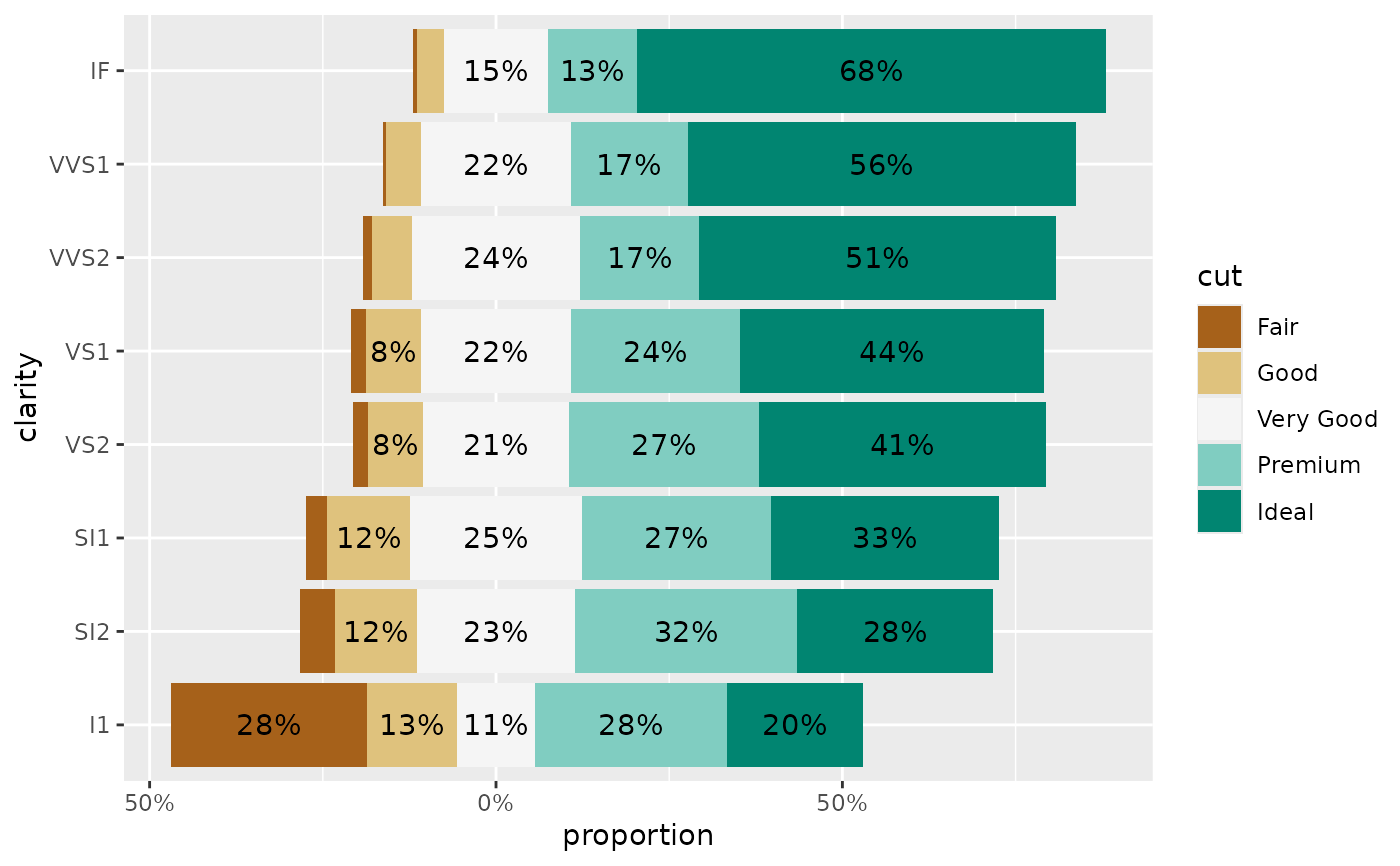
 # Add labels ----------------------------------------------------------------
custom_label <- function(x) {
p <- scales::percent(x, accuracy = 1)
p[x < .075] <- ""
p
}
ggplot(diamonds) +
aes(y = clarity, fill = cut) +
geom_bar(position = "likert") +
geom_text(
aes(by = clarity, label = custom_label(after_stat(prop))),
stat = "prop",
position = position_likert(vjust = .5)
) +
scale_x_continuous(label = label_percent_abs()) +
scale_fill_likert() +
xlab("proportion")
# Add labels ----------------------------------------------------------------
custom_label <- function(x) {
p <- scales::percent(x, accuracy = 1)
p[x < .075] <- ""
p
}
ggplot(diamonds) +
aes(y = clarity, fill = cut) +
geom_bar(position = "likert") +
geom_text(
aes(by = clarity, label = custom_label(after_stat(prop))),
stat = "prop",
position = position_likert(vjust = .5)
) +
scale_x_continuous(label = label_percent_abs()) +
scale_fill_likert() +
xlab("proportion")
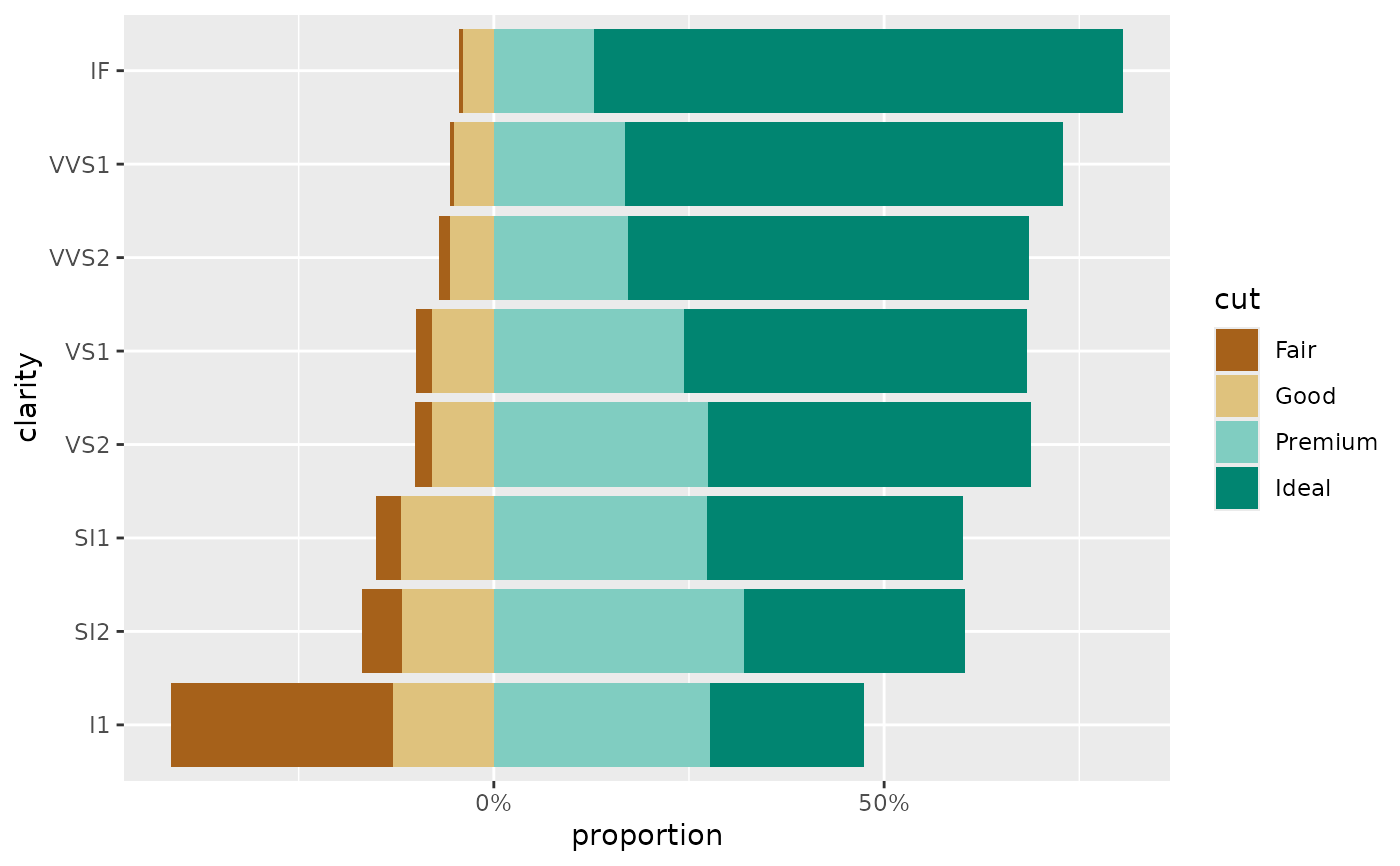
 # Do not display specific fill values ---------------------------------------
# (but taken into account to compute proportions)
ggplot(diamonds) +
aes(y = clarity, fill = cut) +
geom_bar(position = position_likert(exclude_fill_values = "Very Good")) +
scale_x_continuous(label = label_percent_abs()) +
scale_fill_likert() +
xlab("proportion")
# Do not display specific fill values ---------------------------------------
# (but taken into account to compute proportions)
ggplot(diamonds) +
aes(y = clarity, fill = cut) +
geom_bar(position = position_likert(exclude_fill_values = "Very Good")) +
scale_x_continuous(label = label_percent_abs()) +
scale_fill_likert() +
xlab("proportion")
 # }
# }