Method plot for object of class prevR.
Plot clusters, number of observations per cluster or number of positive cases
per cluster.
# S4 method for prevR,missing
plot(
  x,
  type = "position",
  add.legend = TRUE,
  legend.location = "bottomright",
  factor.size = 0.2,
  new.window = FALSE,
  axes = FALSE,
  ...
)
Arguments
- x
object of class prevR.
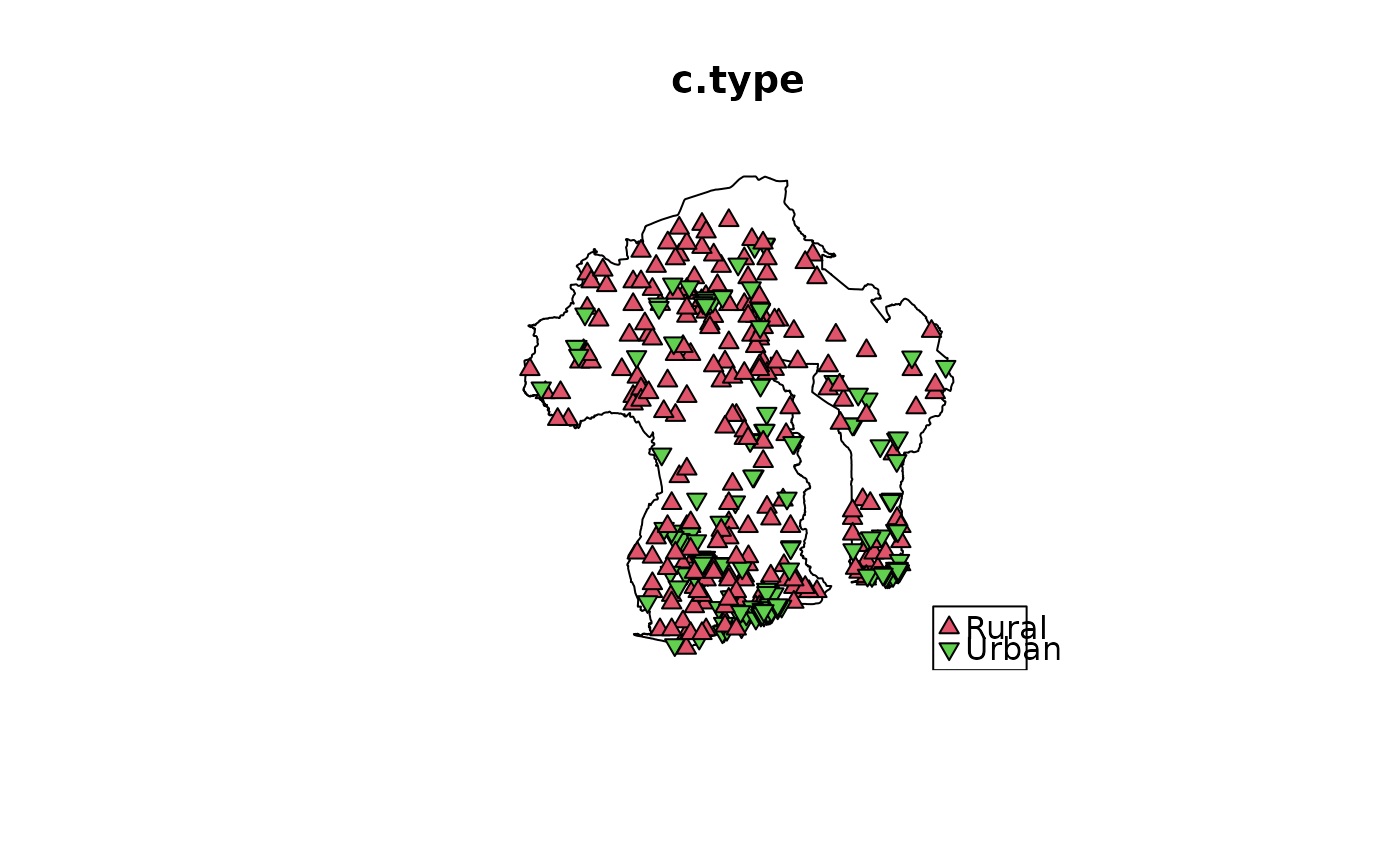
- type
graph to plot:
"position" clusters position.
"c.type" clusters per
c.type."count" number of observations per cluster.
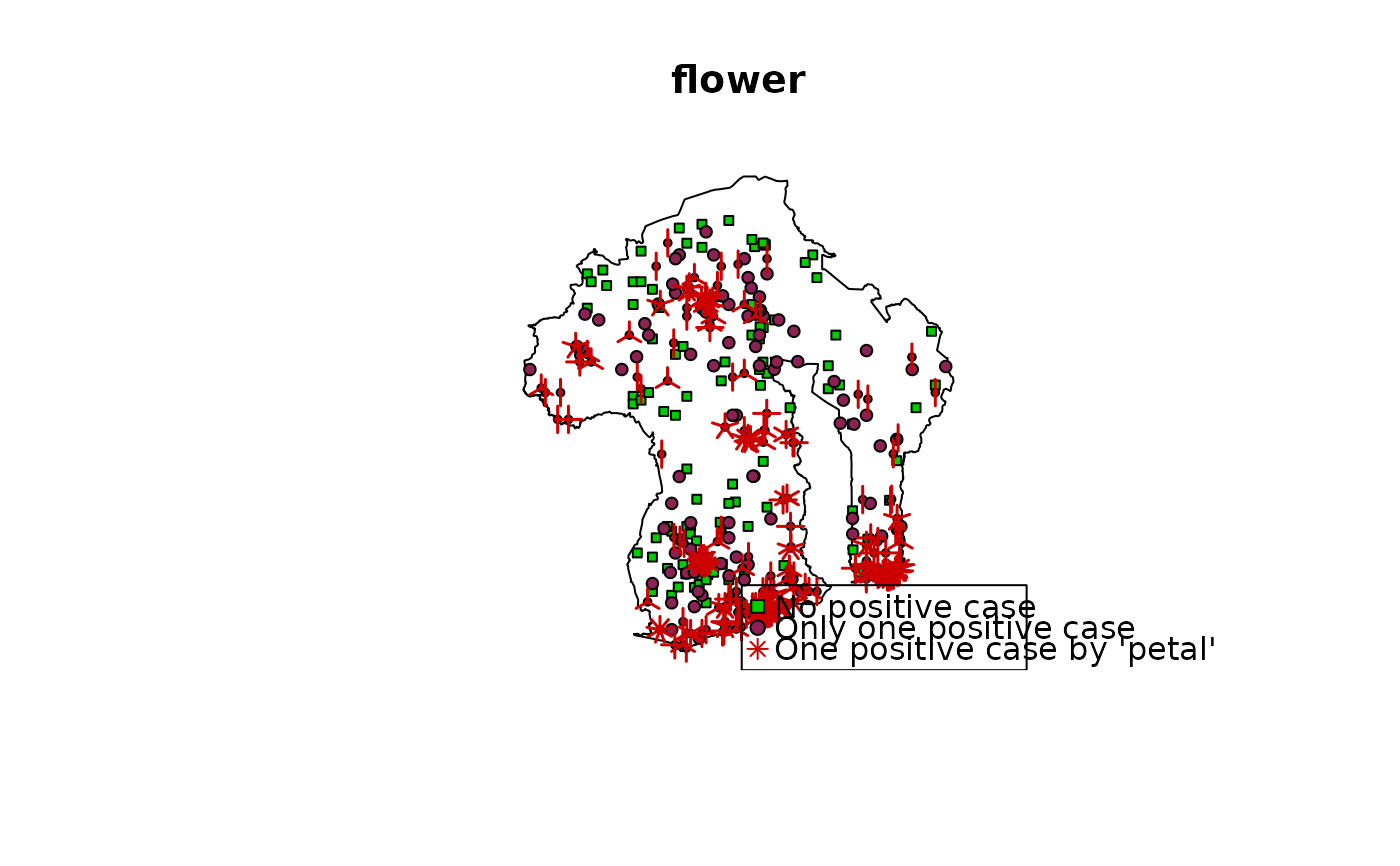
"flower" number of positive cases per cluster.
- add.legend
add a legend?
- legend.location
legend location.
- factor.size
scale factor of rings (for
type="count").- new.window
plot in a new window?
- axes
show axes?
- ...
additional arguments transmitted to
graphics::title().
Details
Available values for legend.location are: "bottomright",
"bottom", "bottomleft", "left", "topleft",
"top", "topright", "right" use "center".
Use main to define a title and sub for a subtitle
(see graphics::title()).