Plot one or several categorical variables by sub-groups. See proportion()
for more details on the way proportions and confidence intervals are
computed. Return a bar plot (see examples).
Usage
plot_categorical(
  data,
  outcome,
  na.rm = TRUE,
  by = NULL,
  drop_na_by = FALSE,
  convert_continuous = TRUE,
  ...,
  show_overall = TRUE,
  overall_label = "Overall",
  show_pvalues = TRUE,
  pvalues_test = c("fisher", "chisq"),
  pvalues_labeller = scales::label_pvalue(add_p = TRUE),
  pvalues_size = 3.5,
  pvalues_y = ifelse(flip, 1.05, 1),
  show_labels = TRUE,
  labels_labeller = scales::label_percent(1),
  labels_size = 3.5,
  labels_color = "auto",
  facet_labeller = ggplot2::label_wrap_gen(width = 50, multi_line = TRUE),
  flip = FALSE,
  minimal = FALSE,
  return_data = FALSE
)
Arguments
- data
A data frame, data frame extension (e.g. a tibble), or a survey design object.
- outcome
<
tidy-select>
List of categorical variables to be plotted.- na.rm
Should
NAvalues be removed from theoutcome?- by
<
tidy-select>
List of variables to group by (comparison is done separately for each variable).- drop_na_by
Remove
NAvalues inbyvariables?- convert_continuous
Should continuous by variables (with 5 unique values or more) be converted to quartiles (using
cut_quartiles())?- ...
Additional arguments passed to
ggplot2::geom_bar().- show_overall
Display "Overall" column?
- overall_label
Label for the overall column.
- show_pvalues
Display p-values in the top-left corner?
- pvalues_test
Test to compute p-values for data frames:
"fisher"forstats::fisher.test()(withsimulate.p.value = TRUE) or"chisq"forstats::chisq.test(). Has no effect on survey objects for thosesurvey::svychisq()is used.- pvalues_labeller
Labeller function for p-values.
- pvalues_size
Text size for p-values.
- pvalues_y
Y position of p-values.
- show_labels
Display proportion labels?
- labels_labeller
Labeller function for labels.
- labels_size
Size of labels.
- labels_color
Color of labels.
- facet_labeller
Labeller function for strip labels.
- flip
Flip x and y axis?
- minimal
Should a minimal theme be applied? (no y-axis, no grid)
- return_data
Return computed data instead of the plot?
Examples
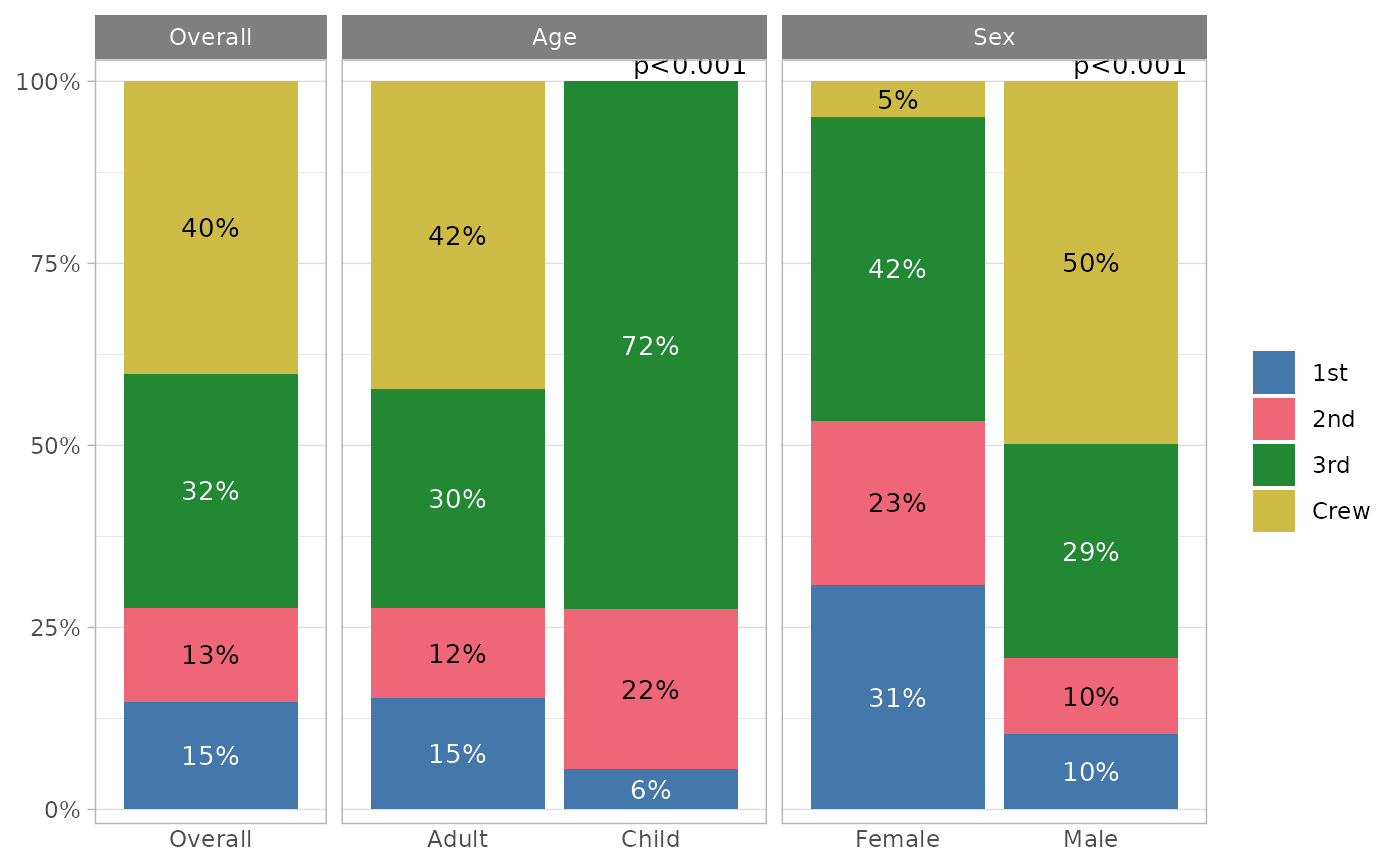
titanic |>
plot_categorical(
Class,
by = c(Age, Sex)
)
 # \donttest{
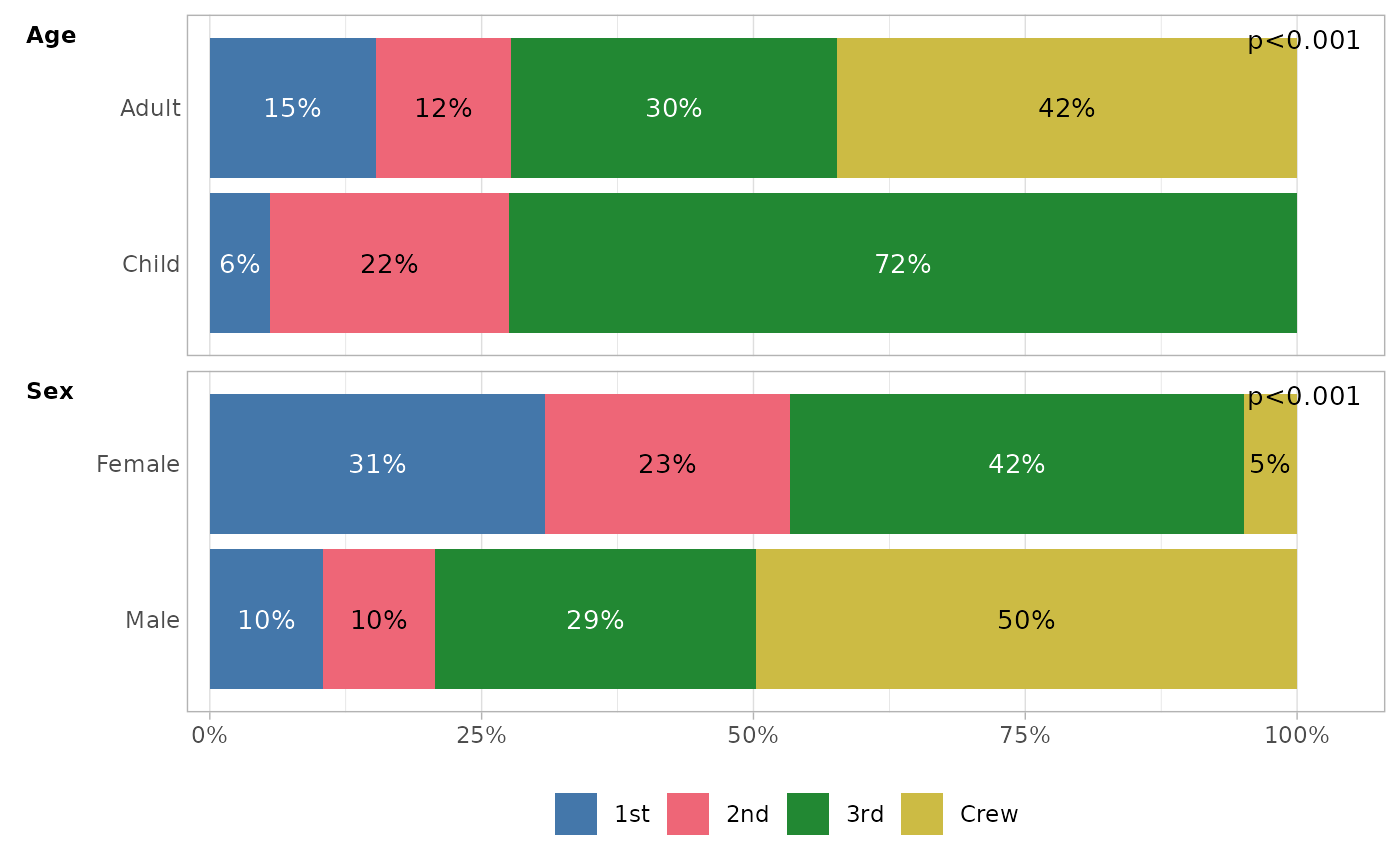
titanic |>
plot_categorical(
Class,
by = c(Age, Sex),
show_overall = FALSE,
flip = TRUE
)
# \donttest{
titanic |>
plot_categorical(
Class,
by = c(Age, Sex),
show_overall = FALSE,
flip = TRUE
)
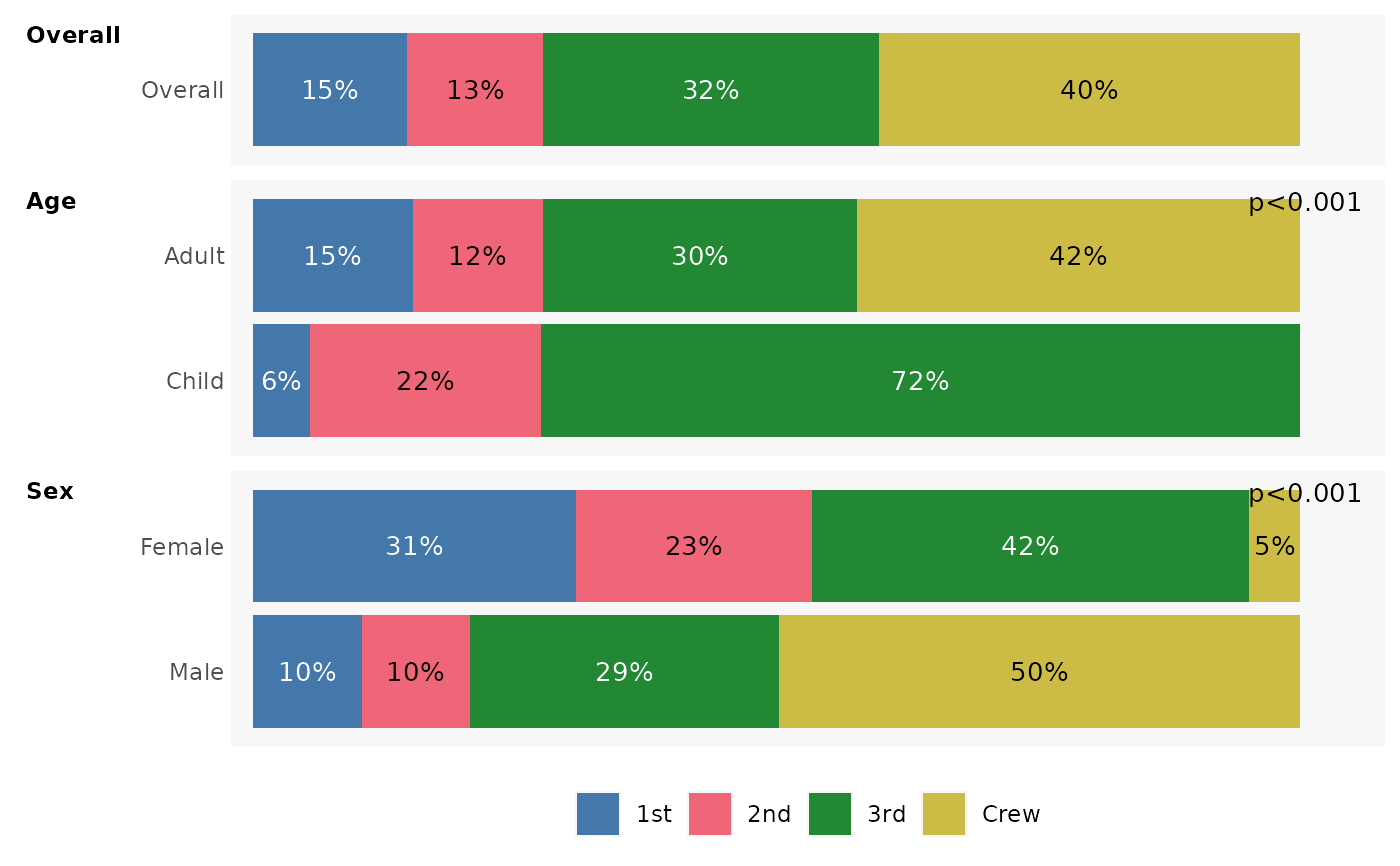
 titanic |>
plot_categorical(
Class,
by = c(Age, Sex),
flip = TRUE,
minimal = TRUE
)
titanic |>
plot_categorical(
Class,
by = c(Age, Sex),
flip = TRUE,
minimal = TRUE
)
 # }
# \donttest{
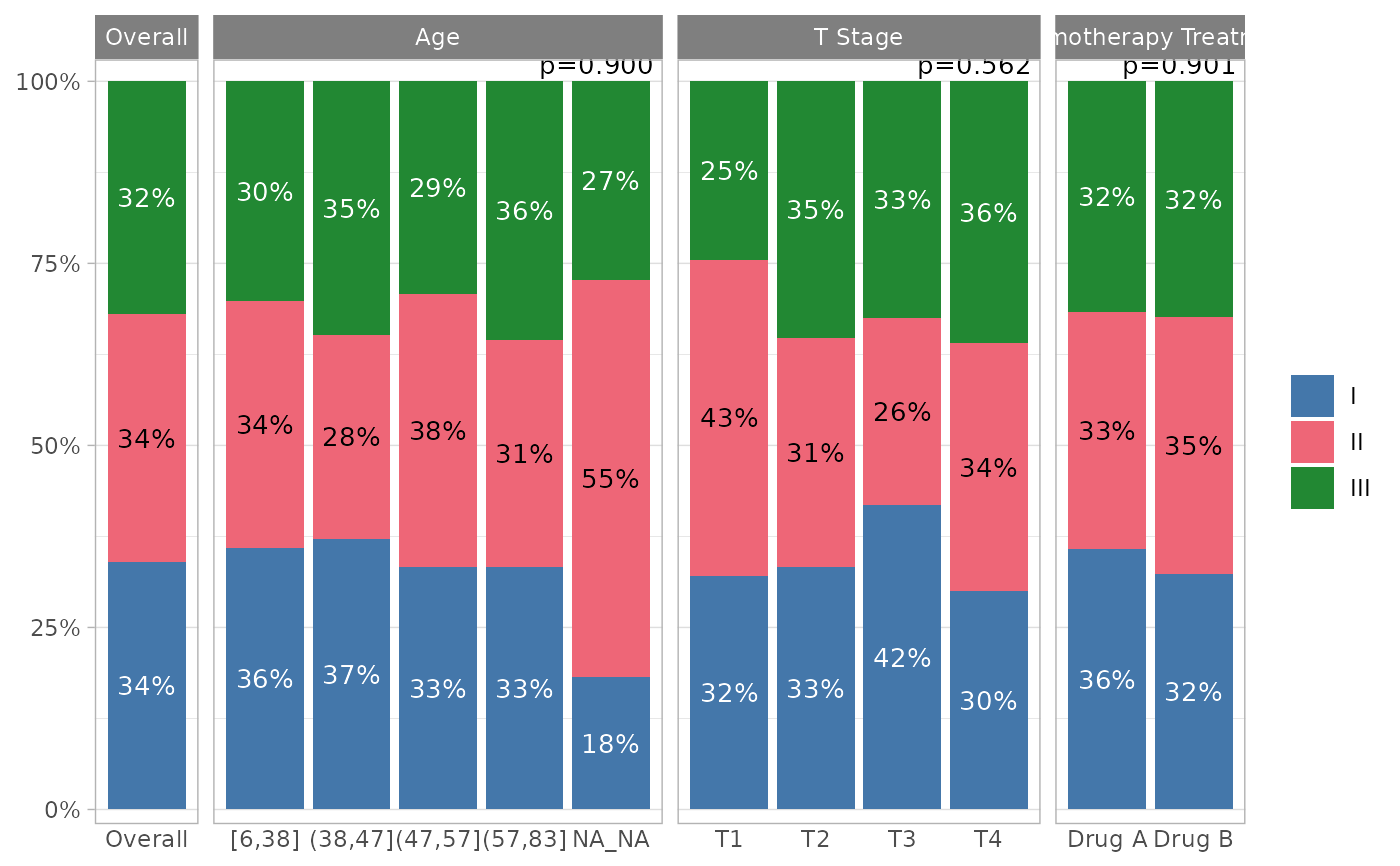
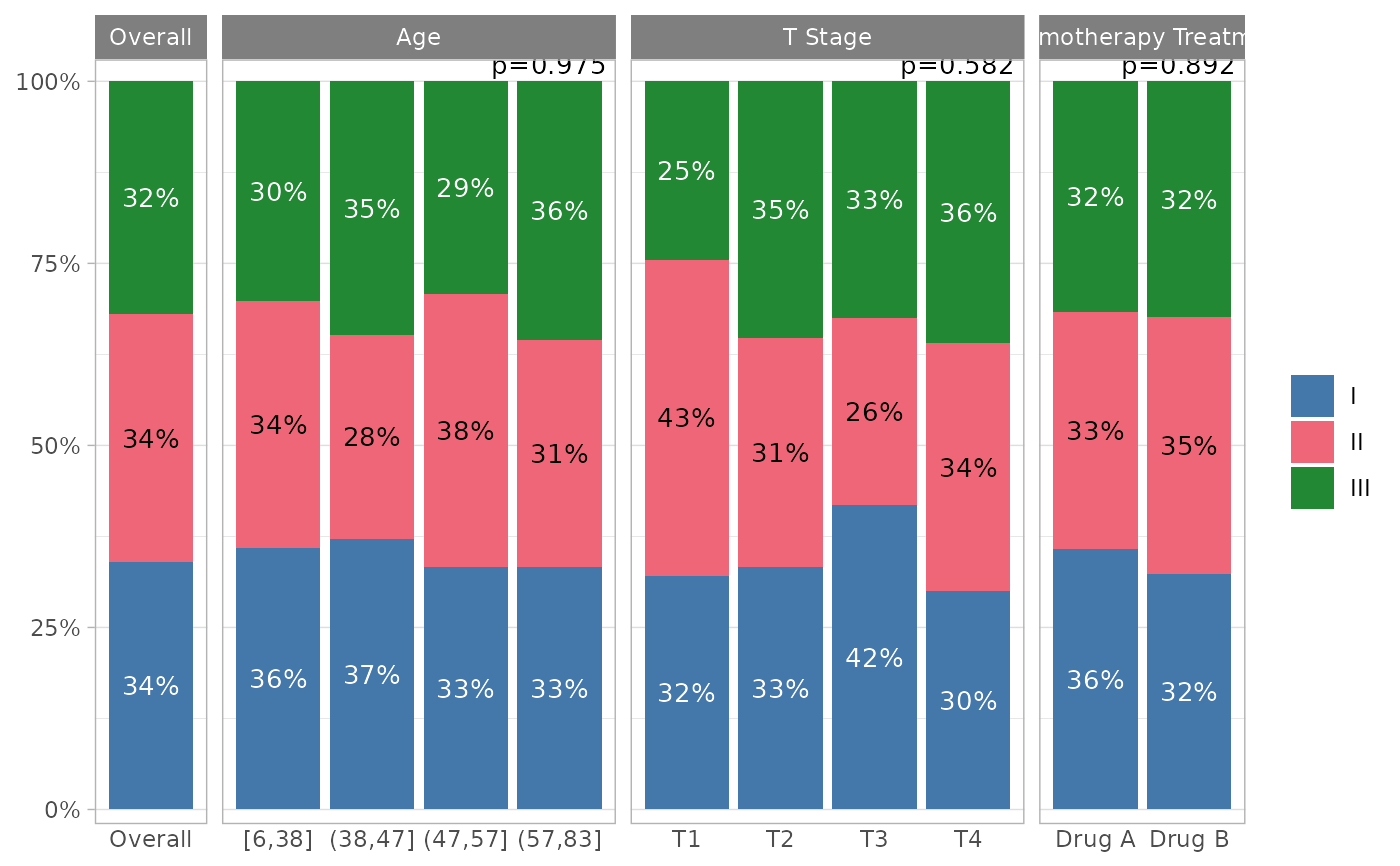
gtsummary::trial |>
plot_categorical(grade, by = c(age, stage, trt))
# }
# \donttest{
gtsummary::trial |>
plot_categorical(grade, by = c(age, stage, trt))
 gtsummary::trial |>
plot_categorical(grade, by = c(age, stage, trt), drop_na_by = TRUE)
gtsummary::trial |>
plot_categorical(grade, by = c(age, stage, trt), drop_na_by = TRUE)
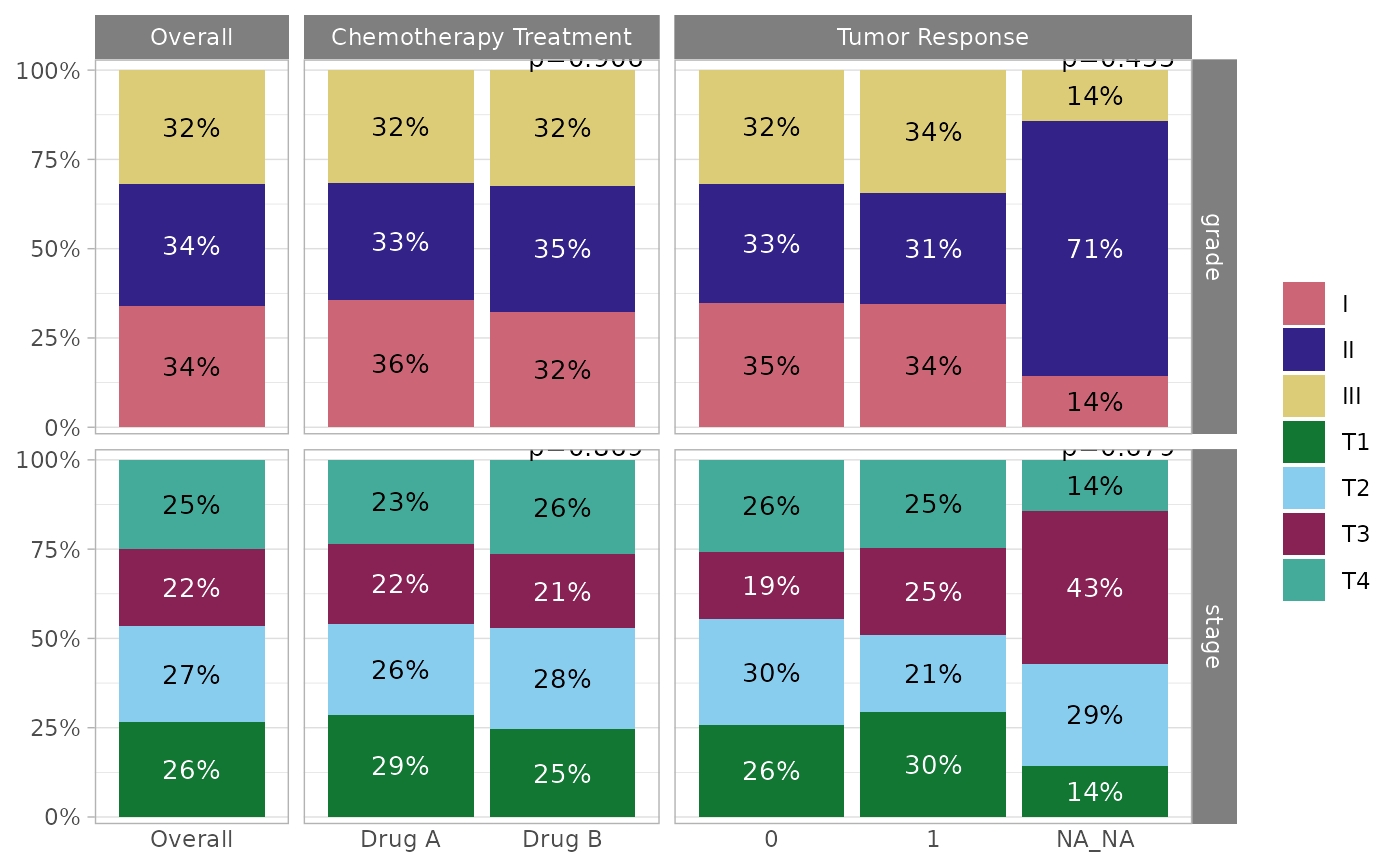
 gtsummary::trial |>
plot_categorical(c(grade, stage), by = c(trt, response))
gtsummary::trial |>
plot_categorical(c(grade, stage), by = c(trt, response))
 # }
# }