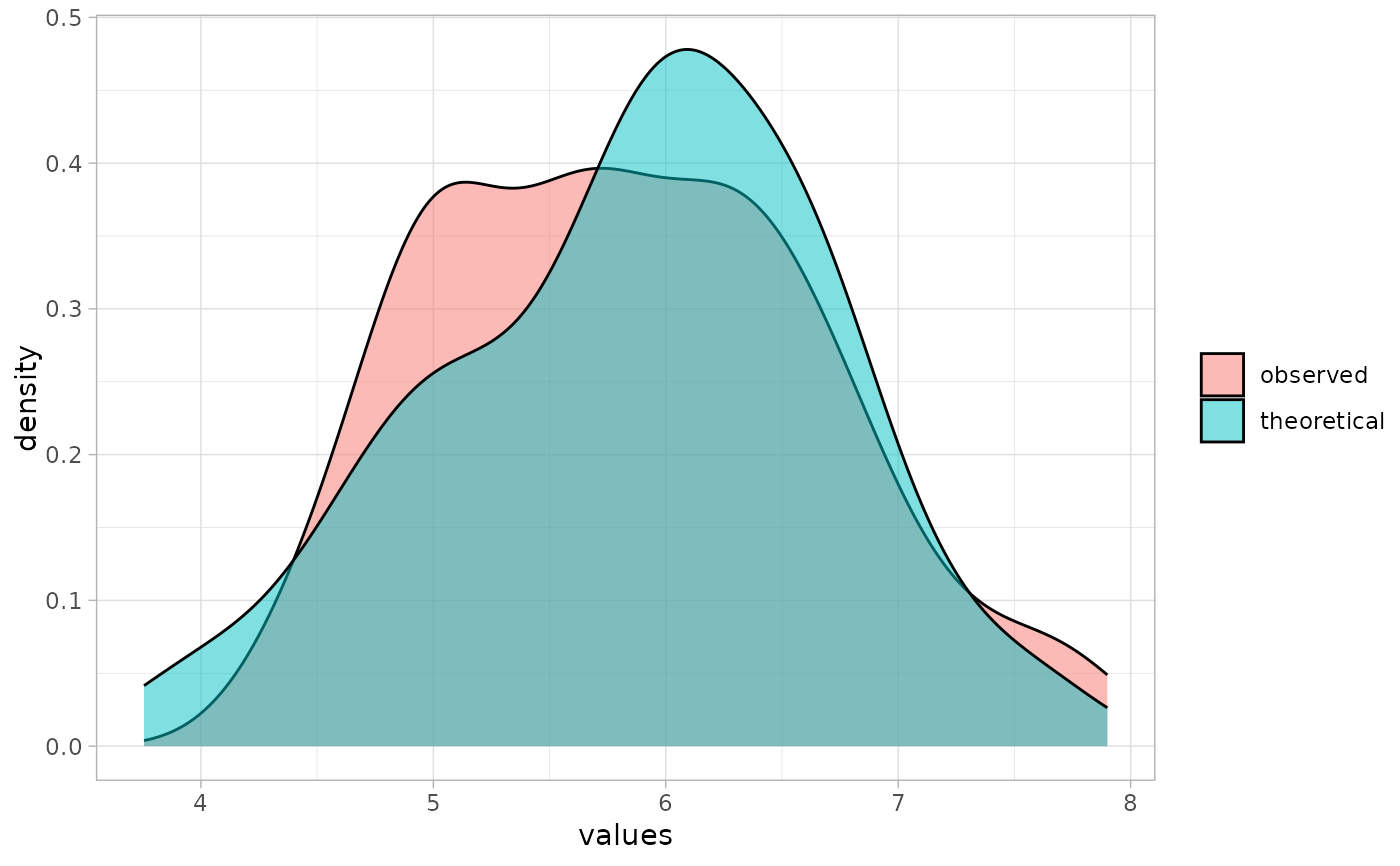
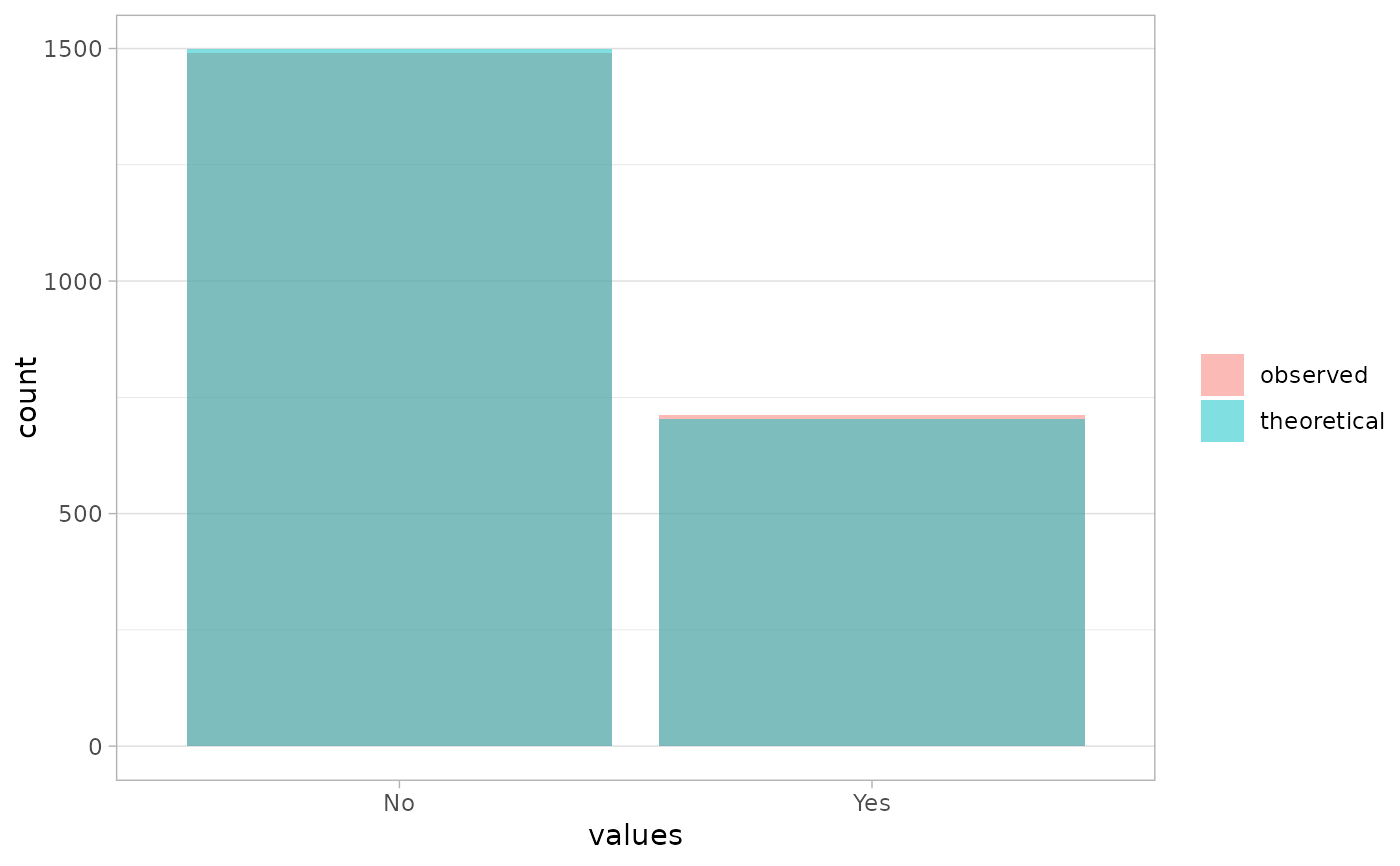
Plot observed vs predicted distribution of a fitted model
Source:R/observed_vs_theoretical.R
observed_vs_theoretical.RdPlot observed vs predicted distribution of a fitted model
Details
Has been tested with stats::lm() and stats::glm() models. It may work
with other types of models, but without any warranty.