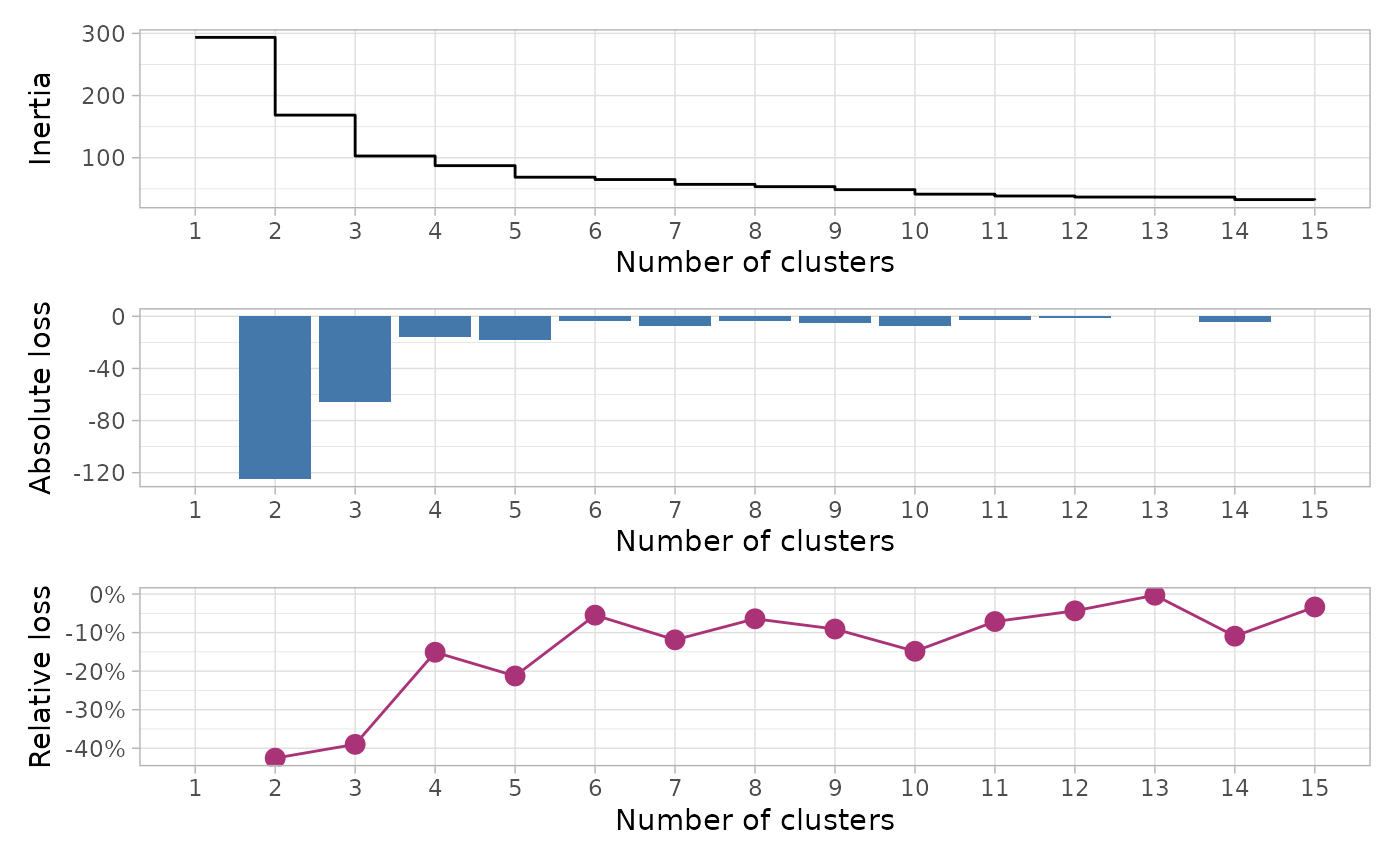
Plot inertia, absolute loss and relative loss from a classification tree
Source:R/plot_inertia_from_tree.R
plot_inertia_from_tree.RdPlot inertia, absolute loss and relative loss from a classification tree
Arguments
- tree
A dendrogram, i.e. an stats::hclust object, an FactoMineR::HCPC object or an object that can be converted to an stats::hclust object with
stats::as.hclust().- k_max
Maximum number of clusters to return / plot.
Examples
hc <- hclust(dist(USArrests))
get_inertia_from_tree(hc)
#> # A tibble: 15 × 4
#>        k inertia absolute_loss relative_loss
#>    <int>   <dbl>         <dbl>         <dbl>
#>  1     1   294.         NA          NA
#>  2     2   169.       -125.         -0.426
#>  3     3   103.        -65.7        -0.390
#>  4     4    87.3       -15.5        -0.151
#>  5     5    68.8       -18.6        -0.213
#>  6     6    65.0        -3.77       -0.0548
#>  7     7    57.3        -7.72       -0.119
#>  8     8    53.6        -3.68       -0.0642
#>  9     9    48.7        -4.87       -0.0908
#> 10    10    41.5        -7.24       -0.149
#> 11    11    38.5        -2.96       -0.0713
#> 12    12    36.8        -1.68       -0.0436
#> 13    13    36.7        -0.113      -0.00307
#> 14    14    32.7        -4.02       -0.109
#> 15    15    31.6        -1.10       -0.0336
plot_inertia_from_tree(hc)